Financial models
Free Excel Templates
12 workbooks with live formulas, charts and a dashboard.
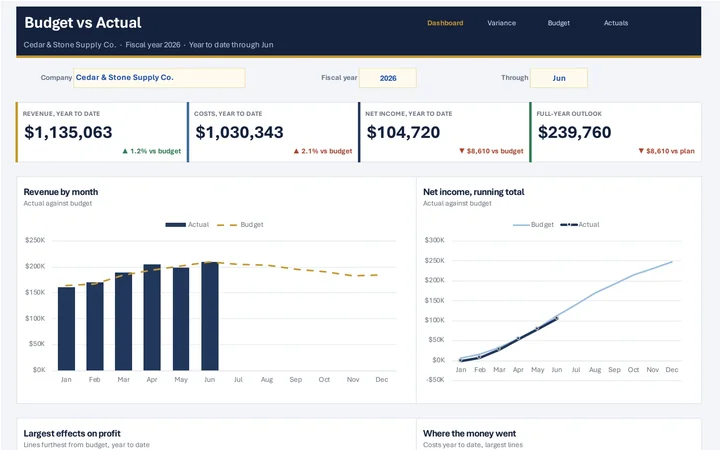
Pick a month and see revenue, costs and profit against budget, with the variances to explain.
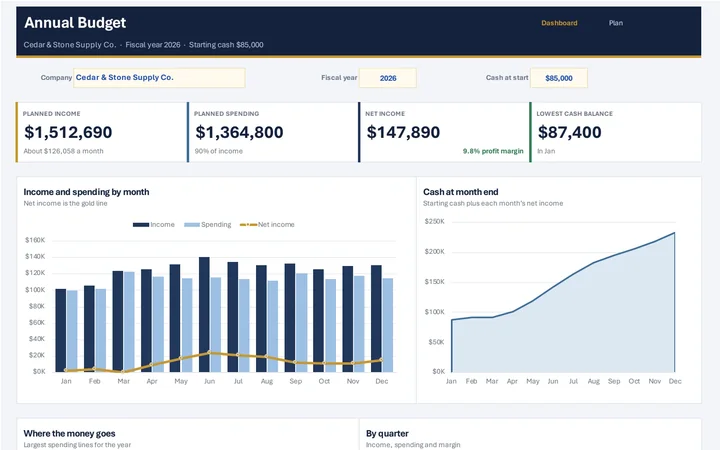
Plan income and spending by month, then see profit, cash and each quarter.
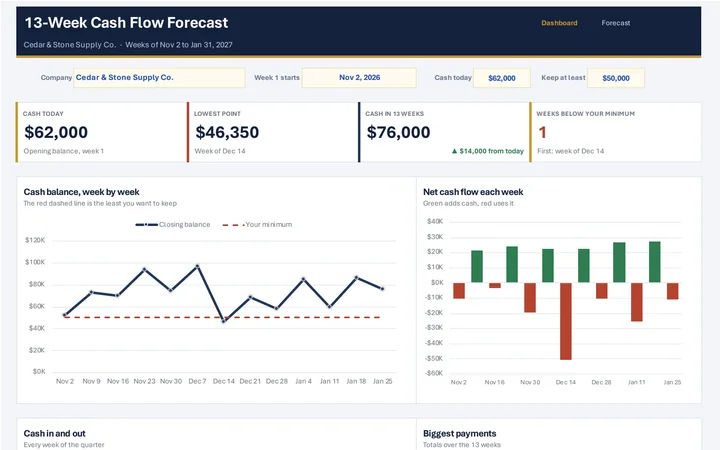
Cash in and out week by week, the low point, and the weeks under your minimum.
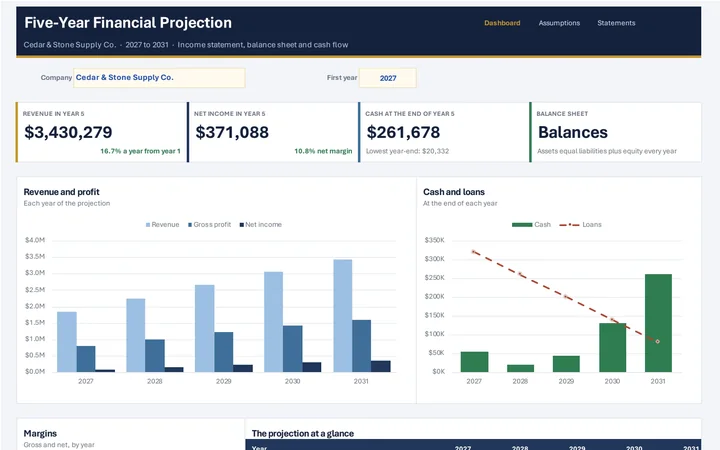
Five years of linked income statement, balance sheet and cash flow that always balance.
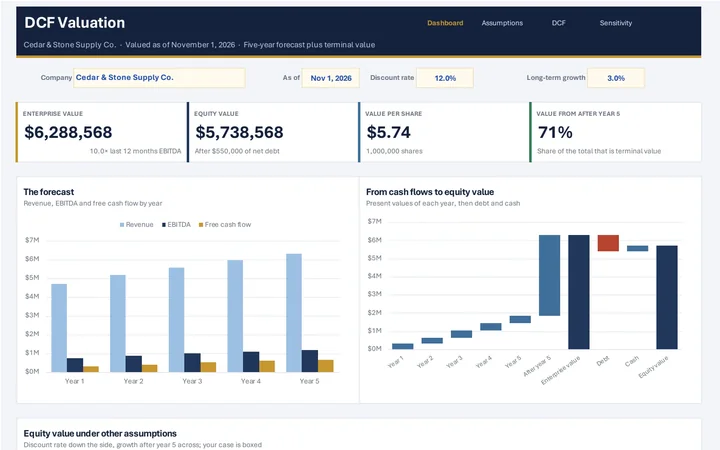
Free cash flow, terminal value, a value bridge and a sensitivity grid.
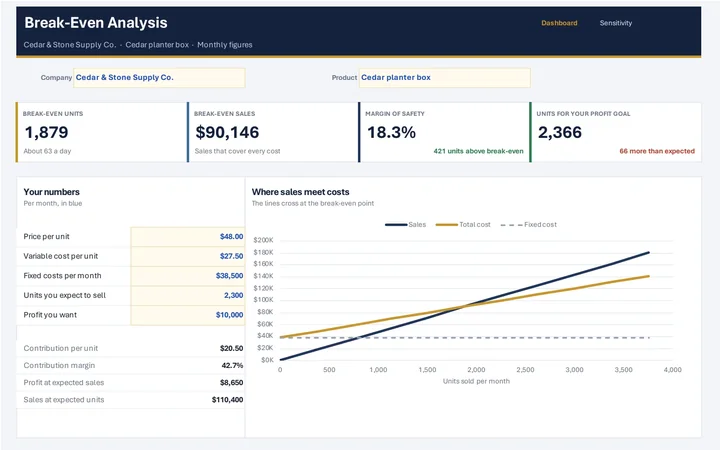
Break-even units and sales, margin of safety and a profit map by price and volume.
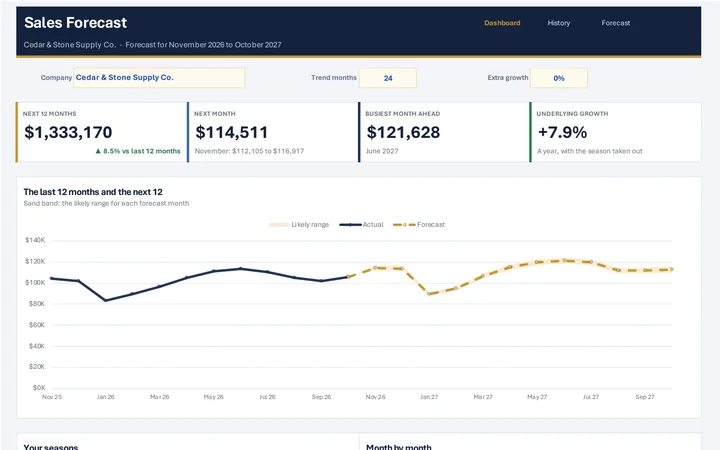
Seasonality and trend from your history, with a likely range for each month ahead.
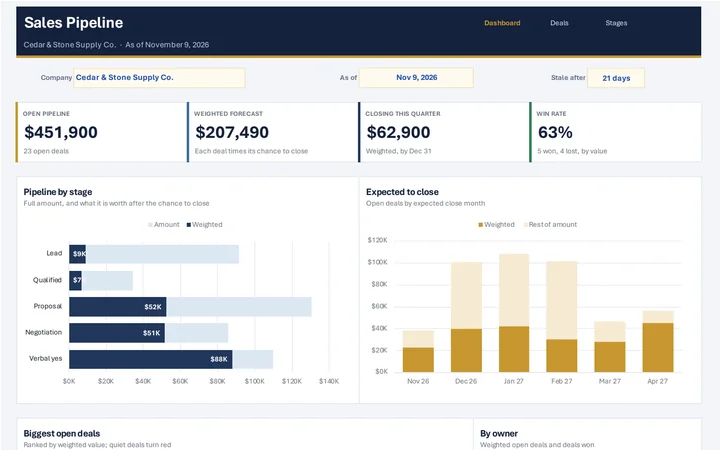
Weighted forecast, a stage funnel, close months, owners and deals going quiet.
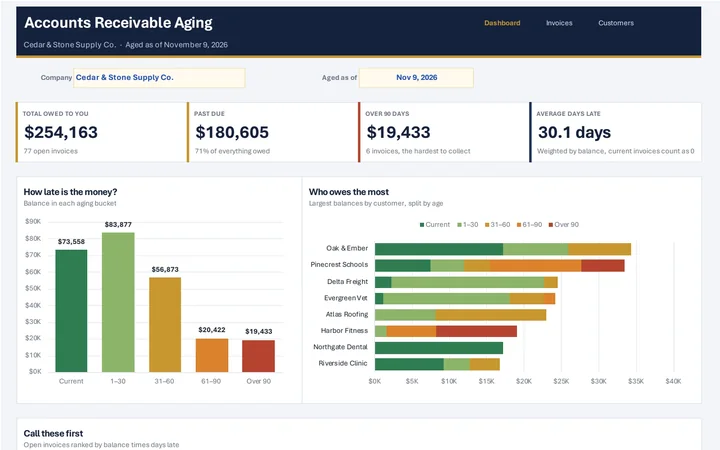
Aging buckets, who owes the most, and the invoices to chase first.
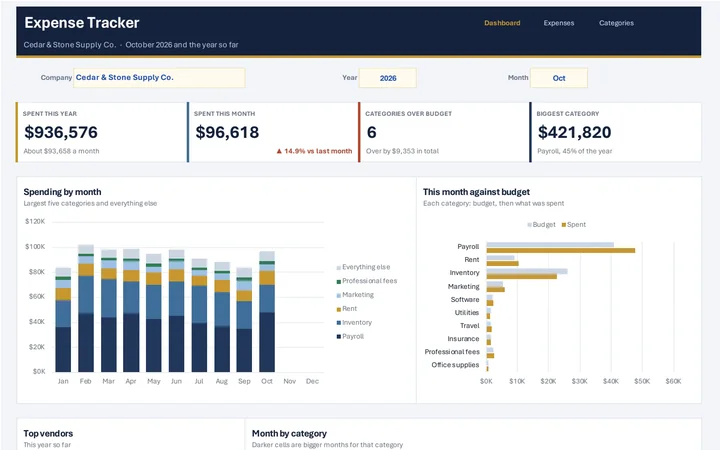
Spending by month and category, against budget, with top vendors and a heat map.
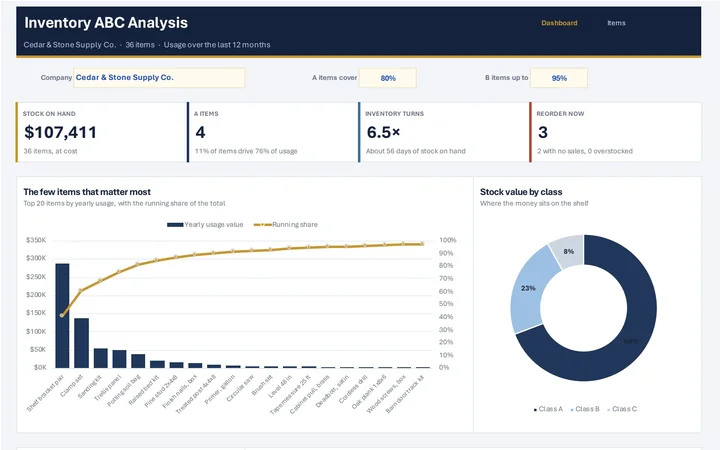
ABC classes with a Pareto chart, turns, stock by category and a reorder list.
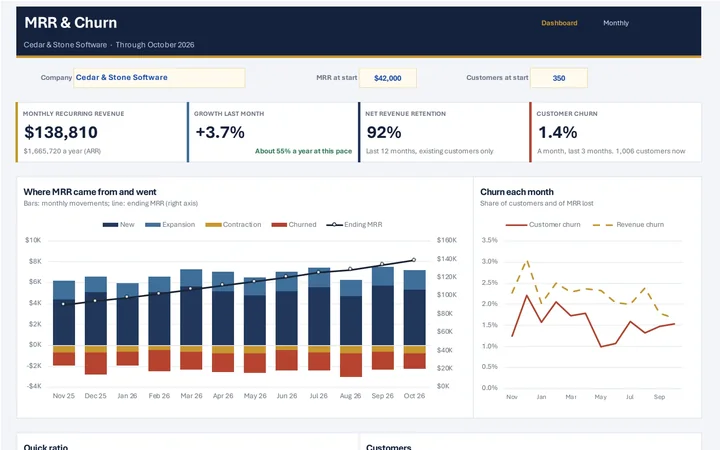
MRR movements, net revenue retention, churn and quick ratio by month.
About these templates
Each template goes with one of the financial models on this site. The model reads a file you already have and gives the answer in your browser; the template is for when you would rather keep the work in Excel and build on it. Click any picture to see every sheet before you download.
How to use a template
- Download the template, or the blank copy if you want to start empty.
- Type your own figures into the pale gold cells.
- Read the dashboard. Change the boxes at the top to try a different month, date or rate.
Frequently asked questions
Are these Excel templates free?
Yes. Every template downloads straight away with no sign-up and no email. Each one comes filled with sample numbers so the dashboard and charts show something, and as a blank copy ready for your own figures.
What is in each workbook?
A dashboard with headline figures and native Excel charts, the sheets where your numbers go, and the sheets that do the math. Every result is a formula you can click on and follow, so nothing is hidden or hard-coded.
Which cells do I fill in?
The pale gold cells with blue type are inputs. Everything else is calculated, and the dashboard updates as soon as you type. Many dashboards also have a month, date or rate box at the top that changes the whole view.
Do they work in Google Sheets or Numbers?
Yes. Open the file in Google Sheets or Apple Numbers and the formulas, charts and colors come across. Sparklines and in-cell data bars are Excel features, so Google Sheets leaves those small extras out.
How were the formulas checked?
Each template is opened in Microsoft Excel and its headline figures are compared with the same calculation done separately, outside the spreadsheet. A template is only published when they match.